Release 2.41
Aerial Inspections, Emission Plumes
What's New
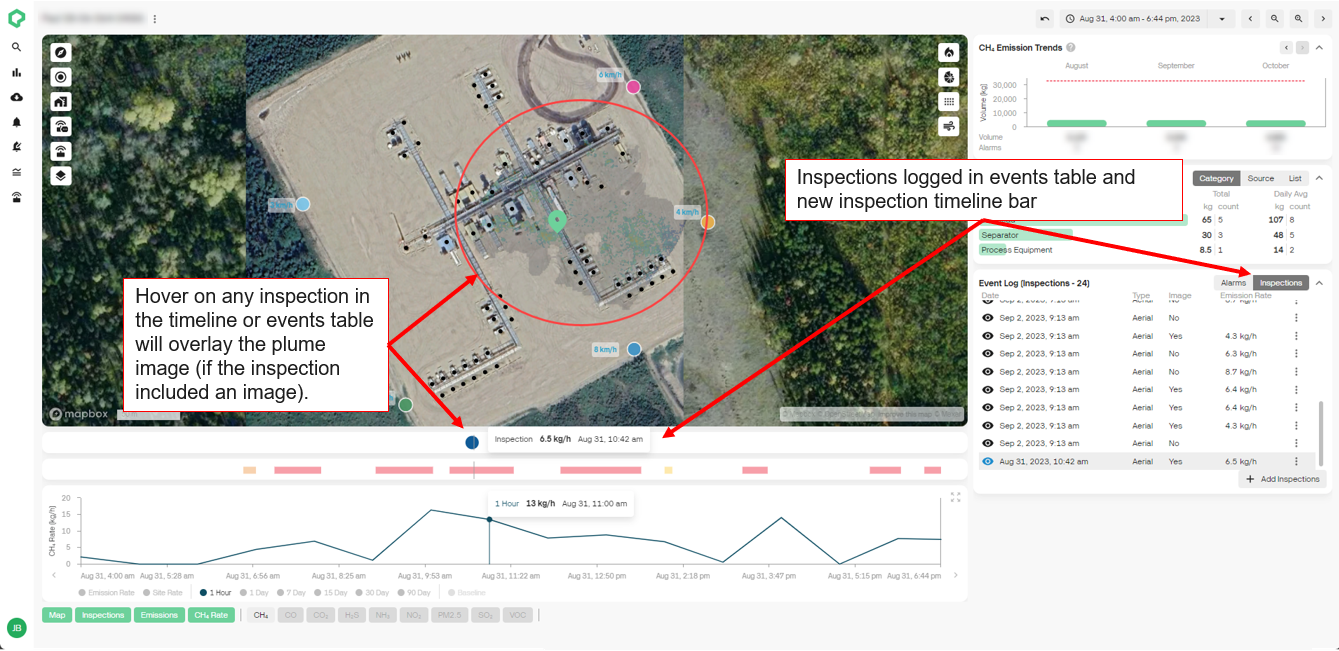
- Aerial Inspections: Upload and document your flyover inspections directly to the Qube Platform! View your inspection and Qube results directly on the site map or on the emission timeline for real time comparison in one platform. Increase your confidence in determining emission rates and durations by storing and comparing all your emission monitoring data in one location!
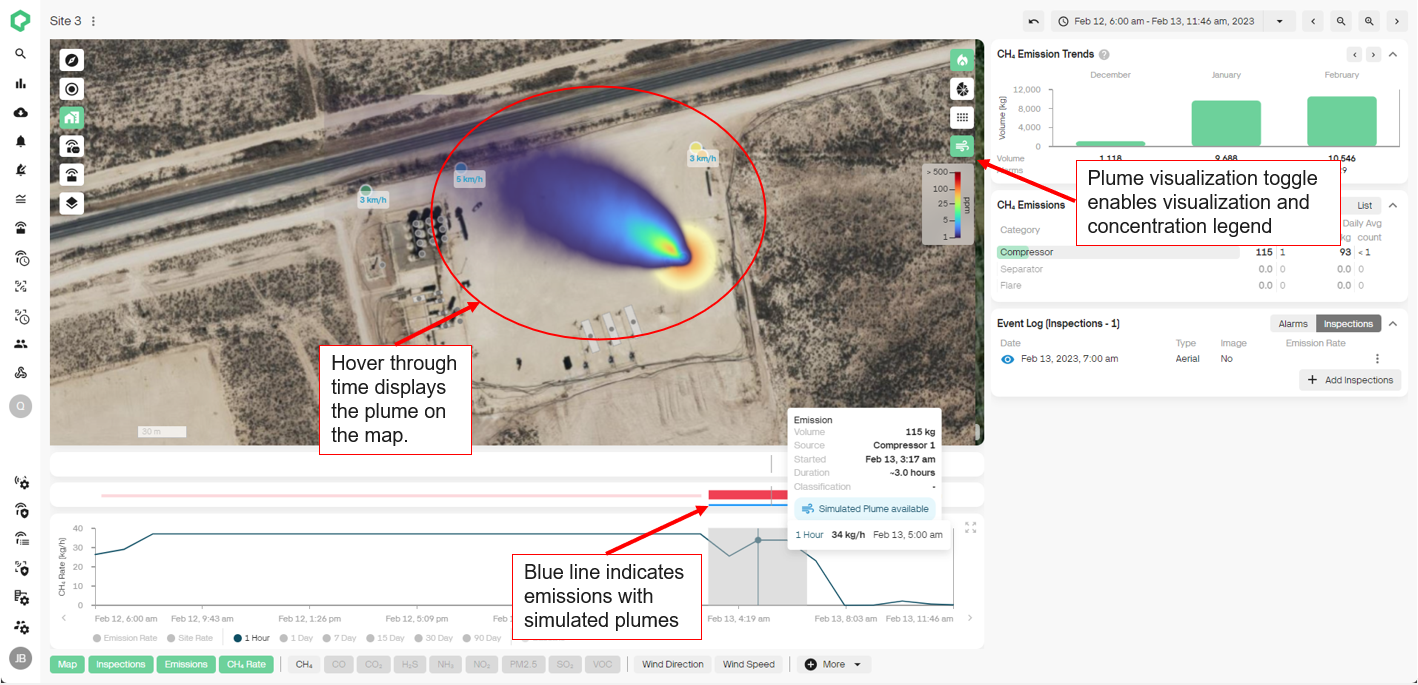
- Emission Plumes: Generate and visualize simulated plumes for your emission events. Overlay simulated plumes with your flyover inspections for direct comparisons to gain greater transparency and understanding of the Qube quantification and localization model through visualization!
What's Coming?
-
Site Status: Track and visualize site performance relative to baseline on the overpage and site dashboard.
-
EPA 7-Day and 90-Day Action Level Exceedance Alarms: Track and alert on EPA 7-day and 90-day rolling averages and action level exceedances for your EPA regulated sites.
Other News
-
Qube is now SOC Type 2 Certified! You can rest assured that your data is safe with us!
-
If you have not read it yet, we highly recommend checking out our most recent blog post:
For more information on how to use these new features, please reach out to your Qube Customer Success Manager.