Release 2.47
Enhanced Mobile UI, Interactive Concentration Roses, & Overview Page Enhancements
What's New
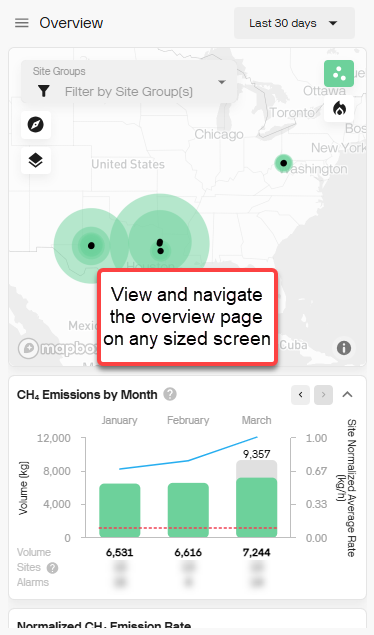
- Enhance Mobile User Interface: Access and navigate your emissions
data from any device.
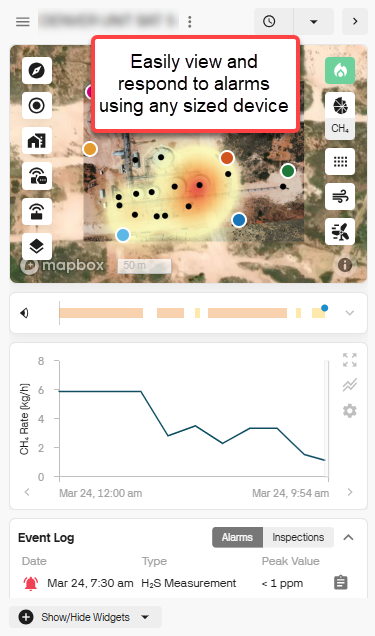
Our redesigned, mobile-friendly interface ensures a smooth experience across all screen sizes. Whether you're in the field or at your desk, you can quickly respond to site-level alarms. Just click the link in any Qube alarm email to be taken directly to the relevant site details.
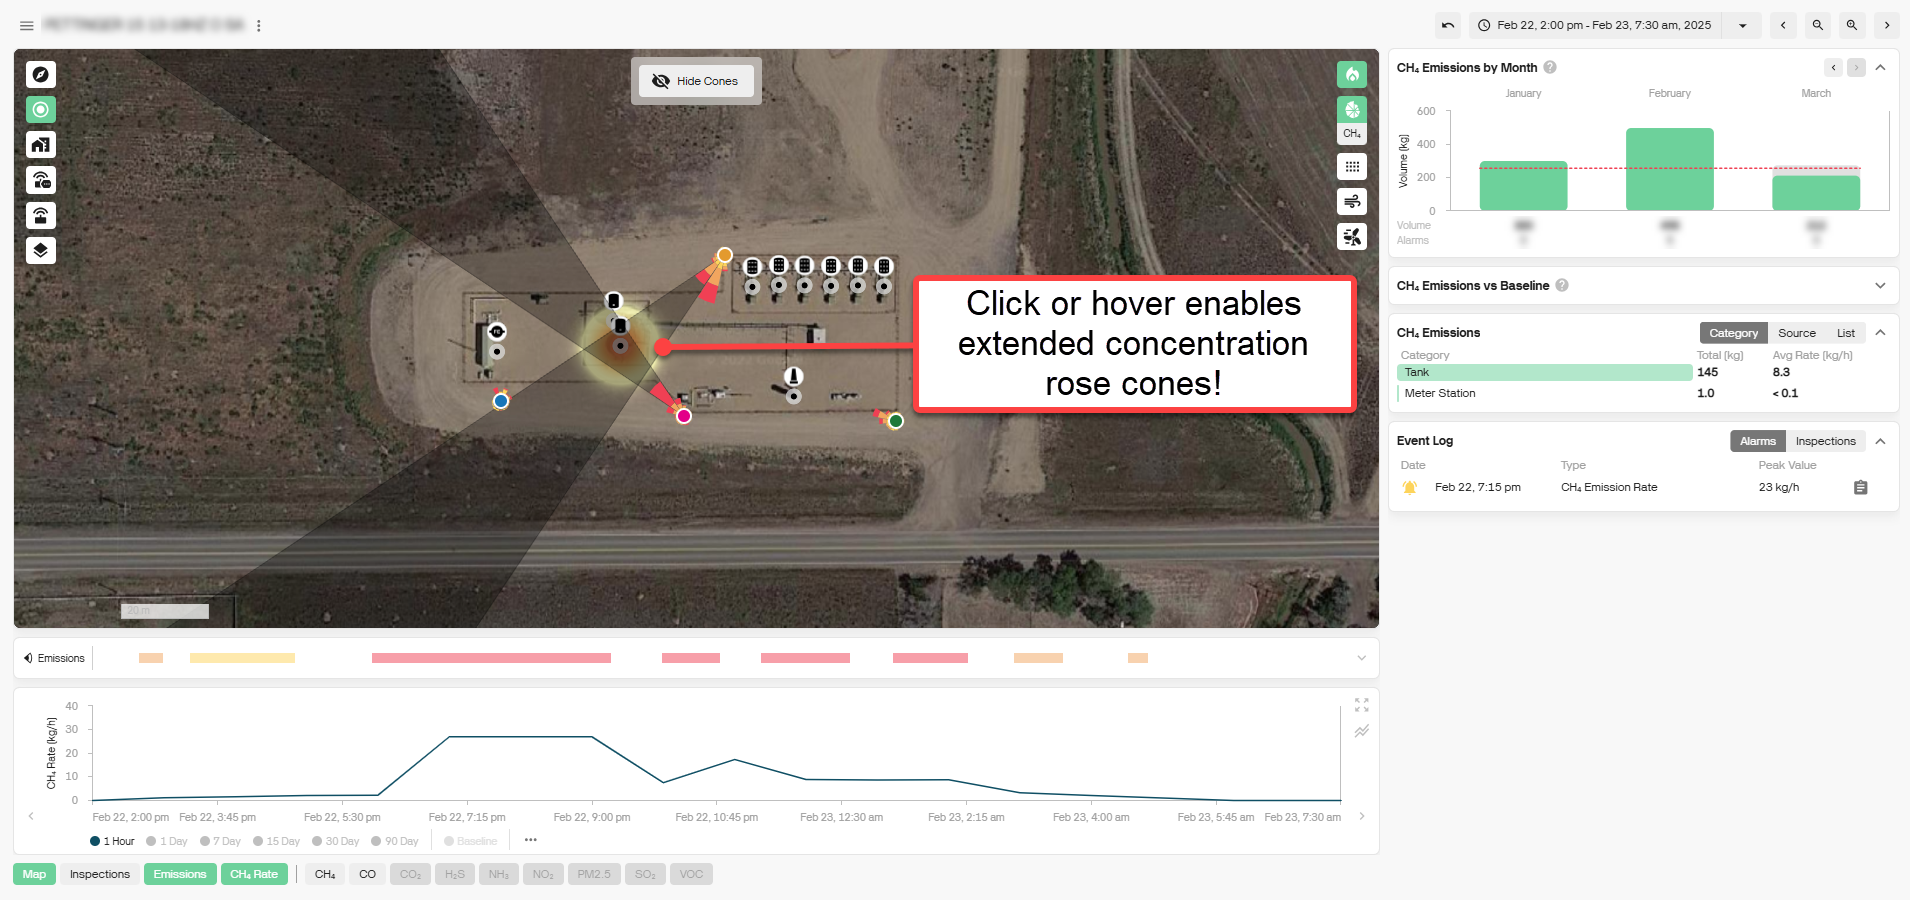
- Interactive Concentration Roses: Quickly pinpoint probable emission sources with our new interactive concentration roses! Easily extend rose cones by hovering for a preview or clicking to lock them in place. This enhanced visualization helps you better analyze potential sources over a given time, making emissions tracking more intuitive and actionable.
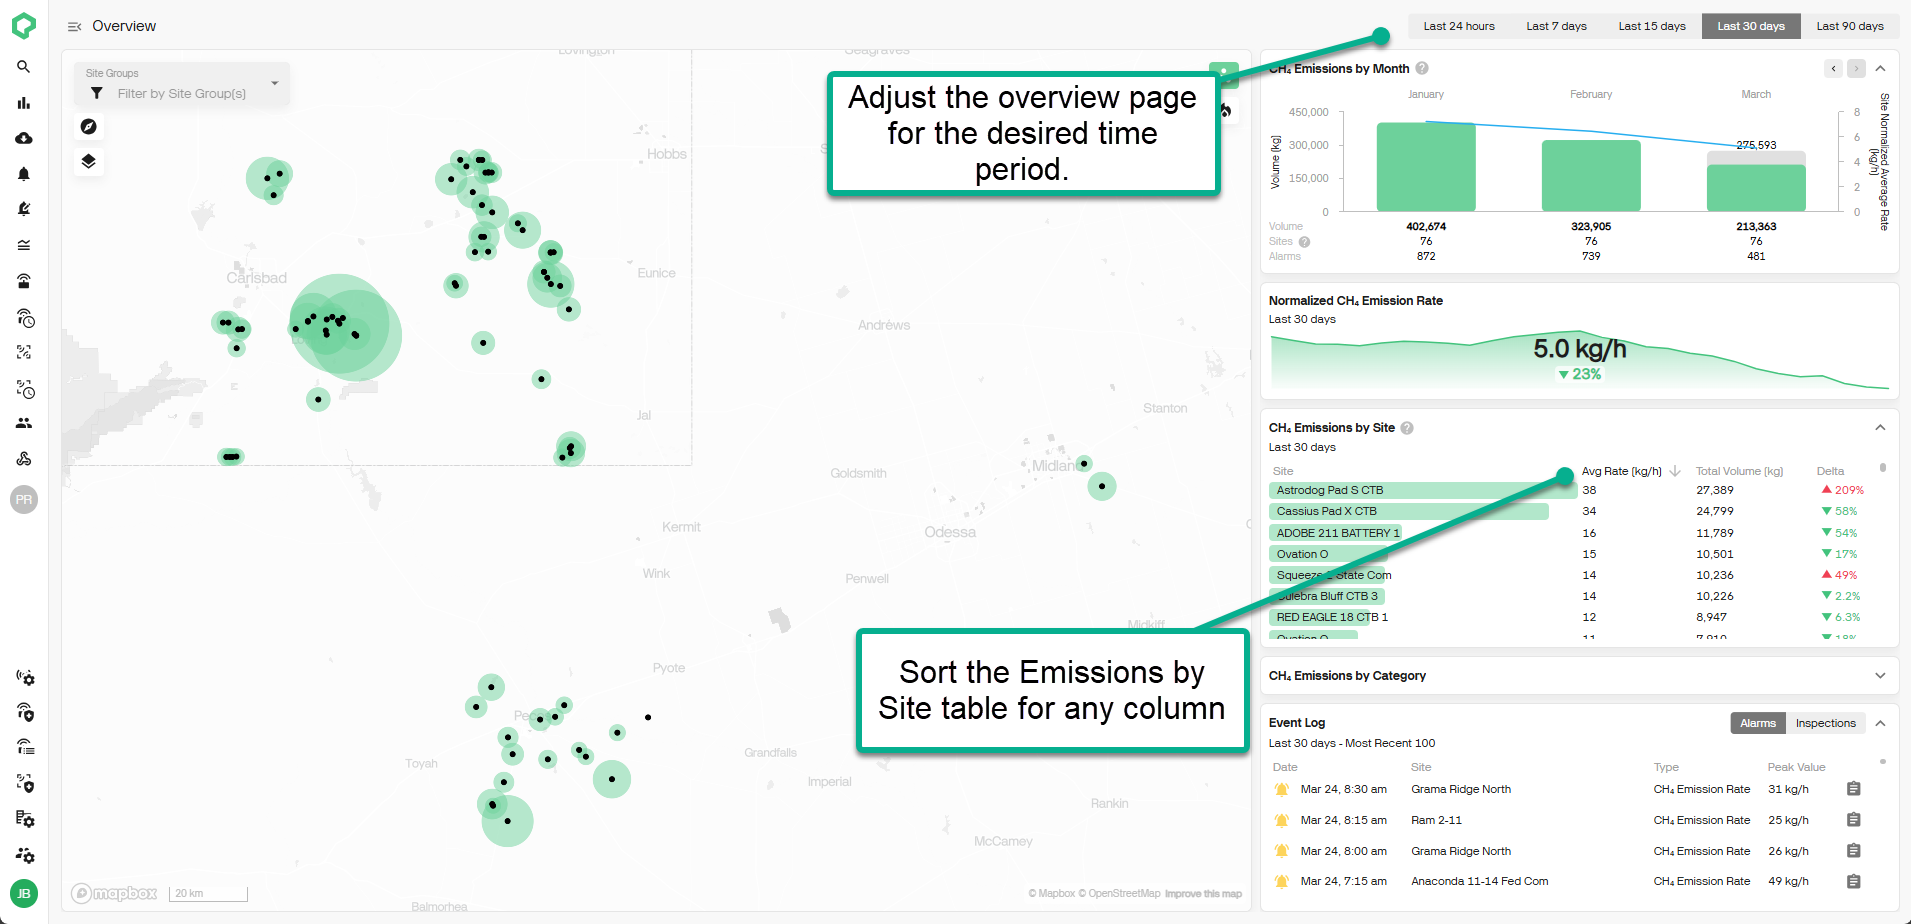
- Overview Page Enhancements: Easily find sites of interest with new sorting and filtering options on the Overview page. Quickly adjust the time range (last 24 hours, 7 days, 15 days, 30 days, or 90 days) and sort the CH₄ Emissions by Site table by any column to identify key trends and priority sites at a glance.