Release 2.45
Site Emission Status, Baseline Editing & Deleting, Non-CH4 Concentration Roses
What's New
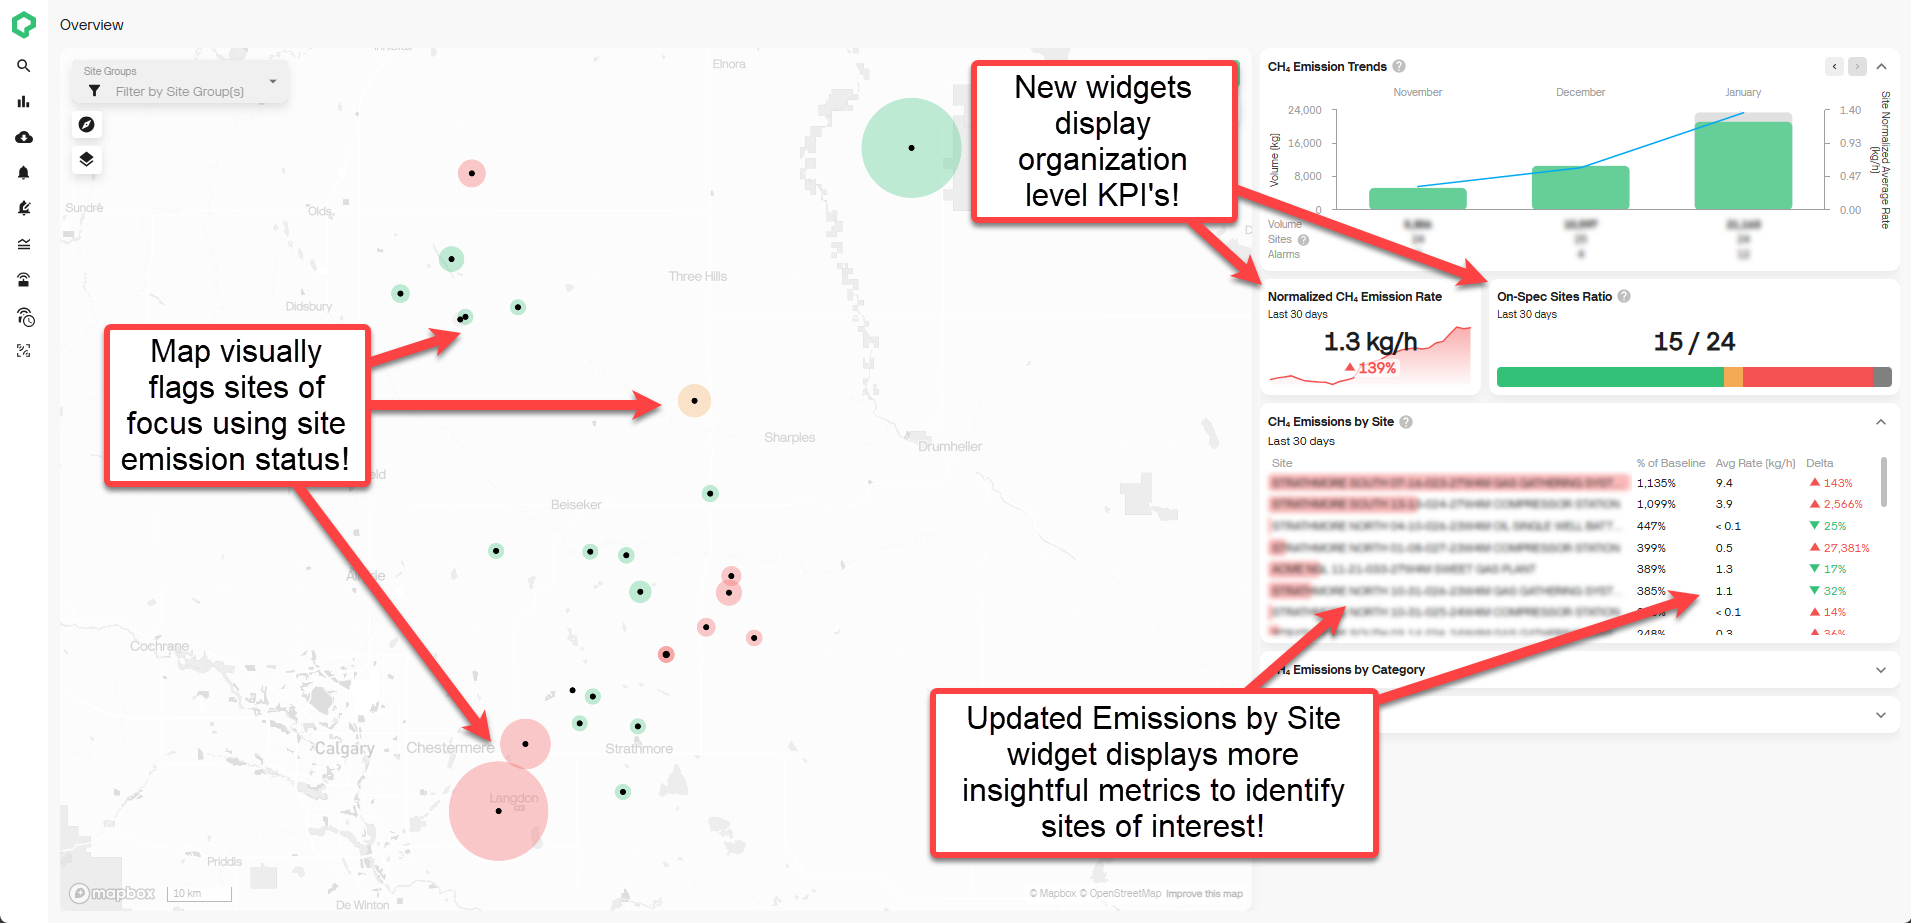
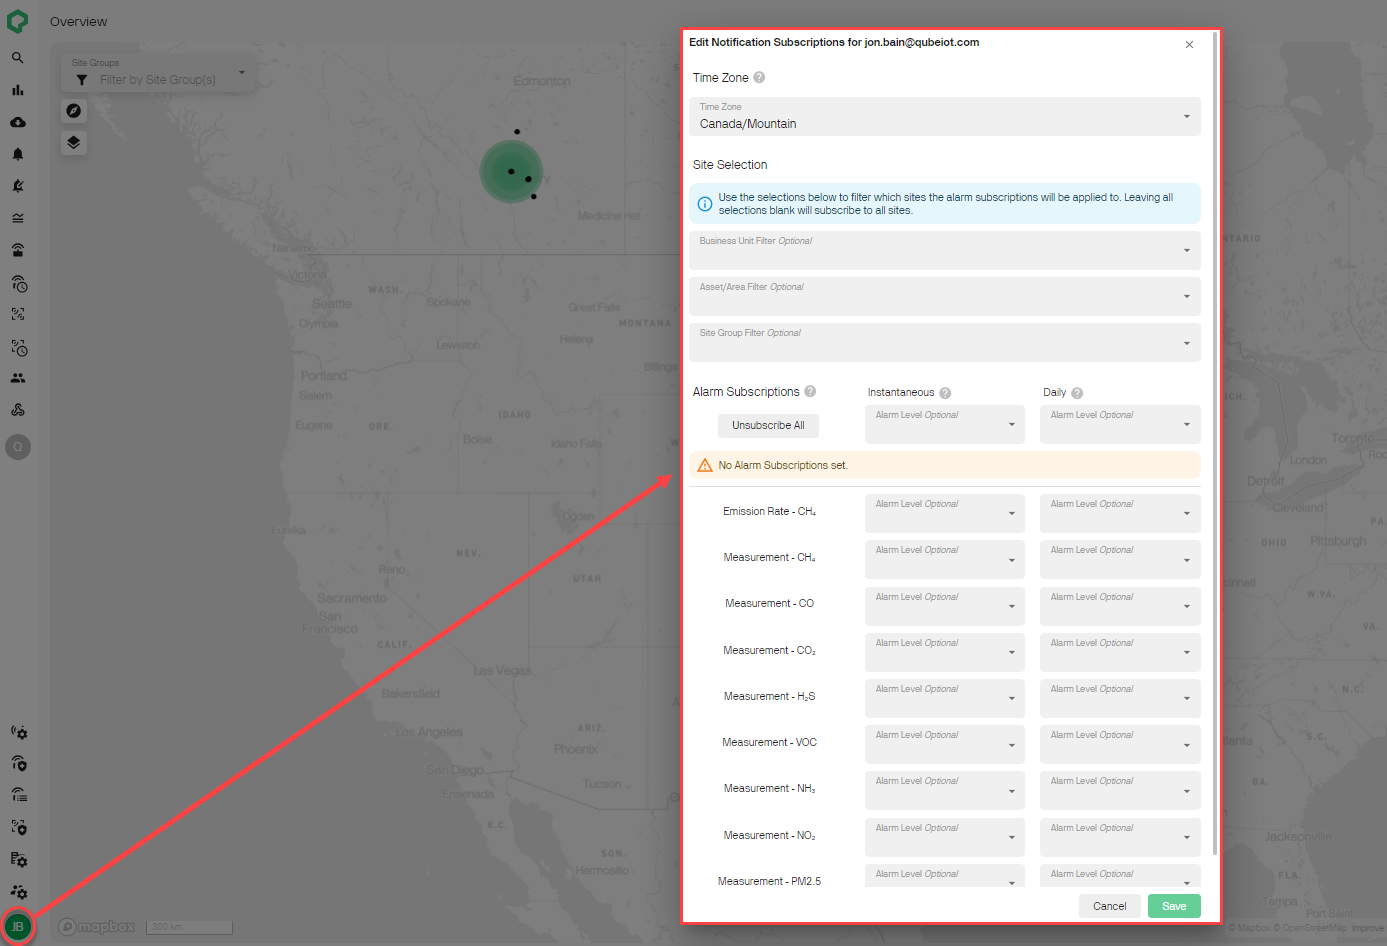
- Site CH4 Emission Status: We now track and visualize your site CH4 emissions relative to baseline across your organization! A site is classified as either below baseline, above baseline or off-spec over the last 30 days. Site emission status is visualized on the site and overview dashboards to provide greater visual indications of sites requiring attention. To enable this feature, all you need to do is set a baseline for your sites!
-
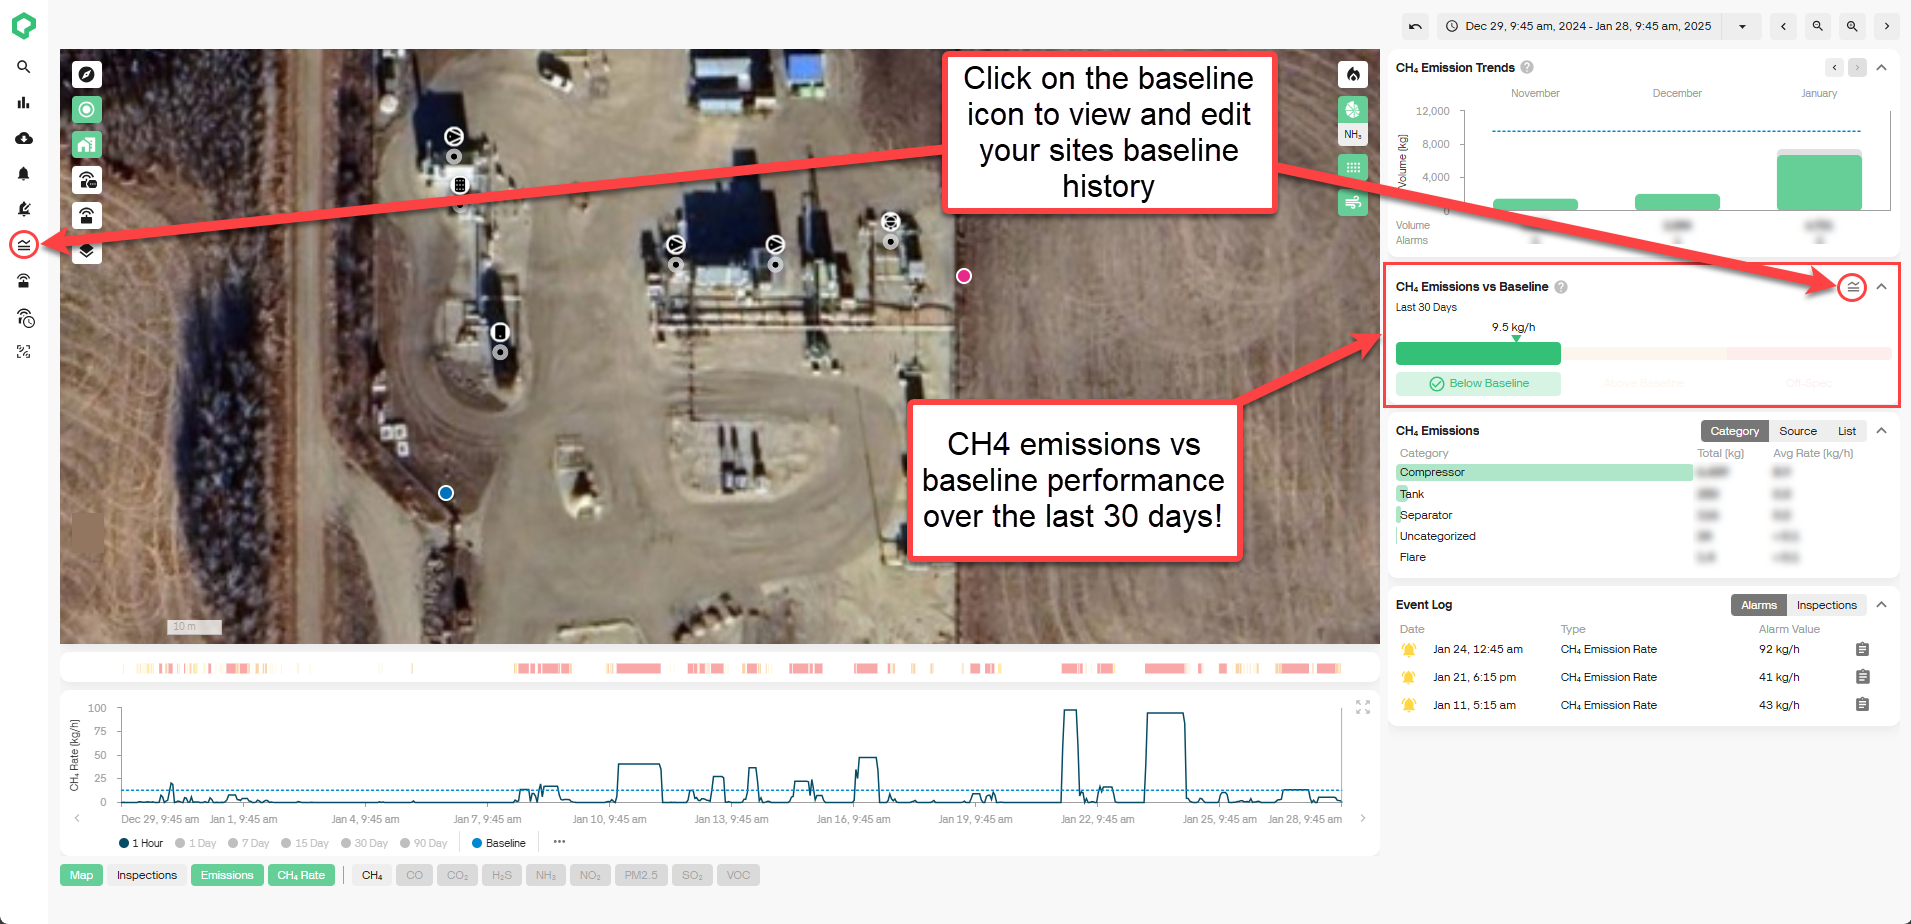
Baseline Editing & Deleting: To provide greater flexibility in setting your sites baselines, we've enabled editing and deleting. You can now edit the Effective To and Effective From dates for any baseline. You can also delete and add historic baselines as required to ensure your site baseline over time matches reality! Simply navigate to the baseline history modal on the baselines page or from the new CH4 emissions vs Baseline modal on the site dashboard to create, edit or delete!
-
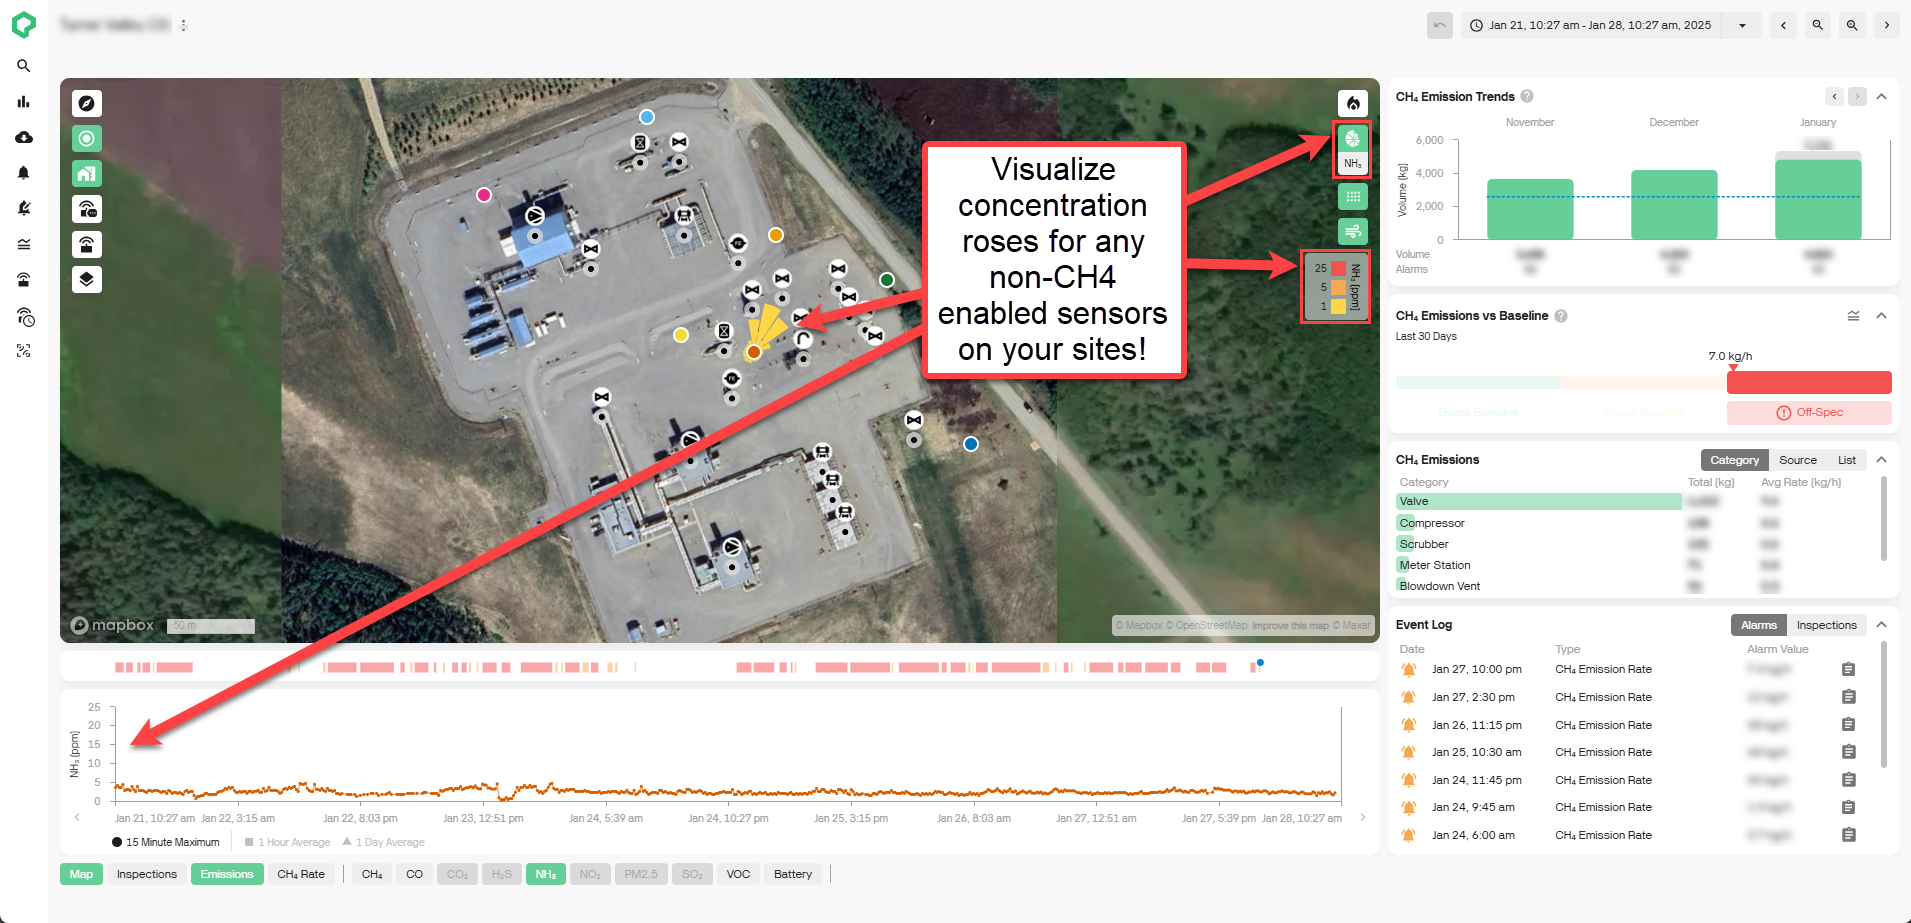
Non-CH4 Concentration Roses: You can now visualize non-CH4 gases concentration roses on the site dashboard map. This will provide you with greater troubleshooting insights into non-CH4 gas transport and severities around your site.
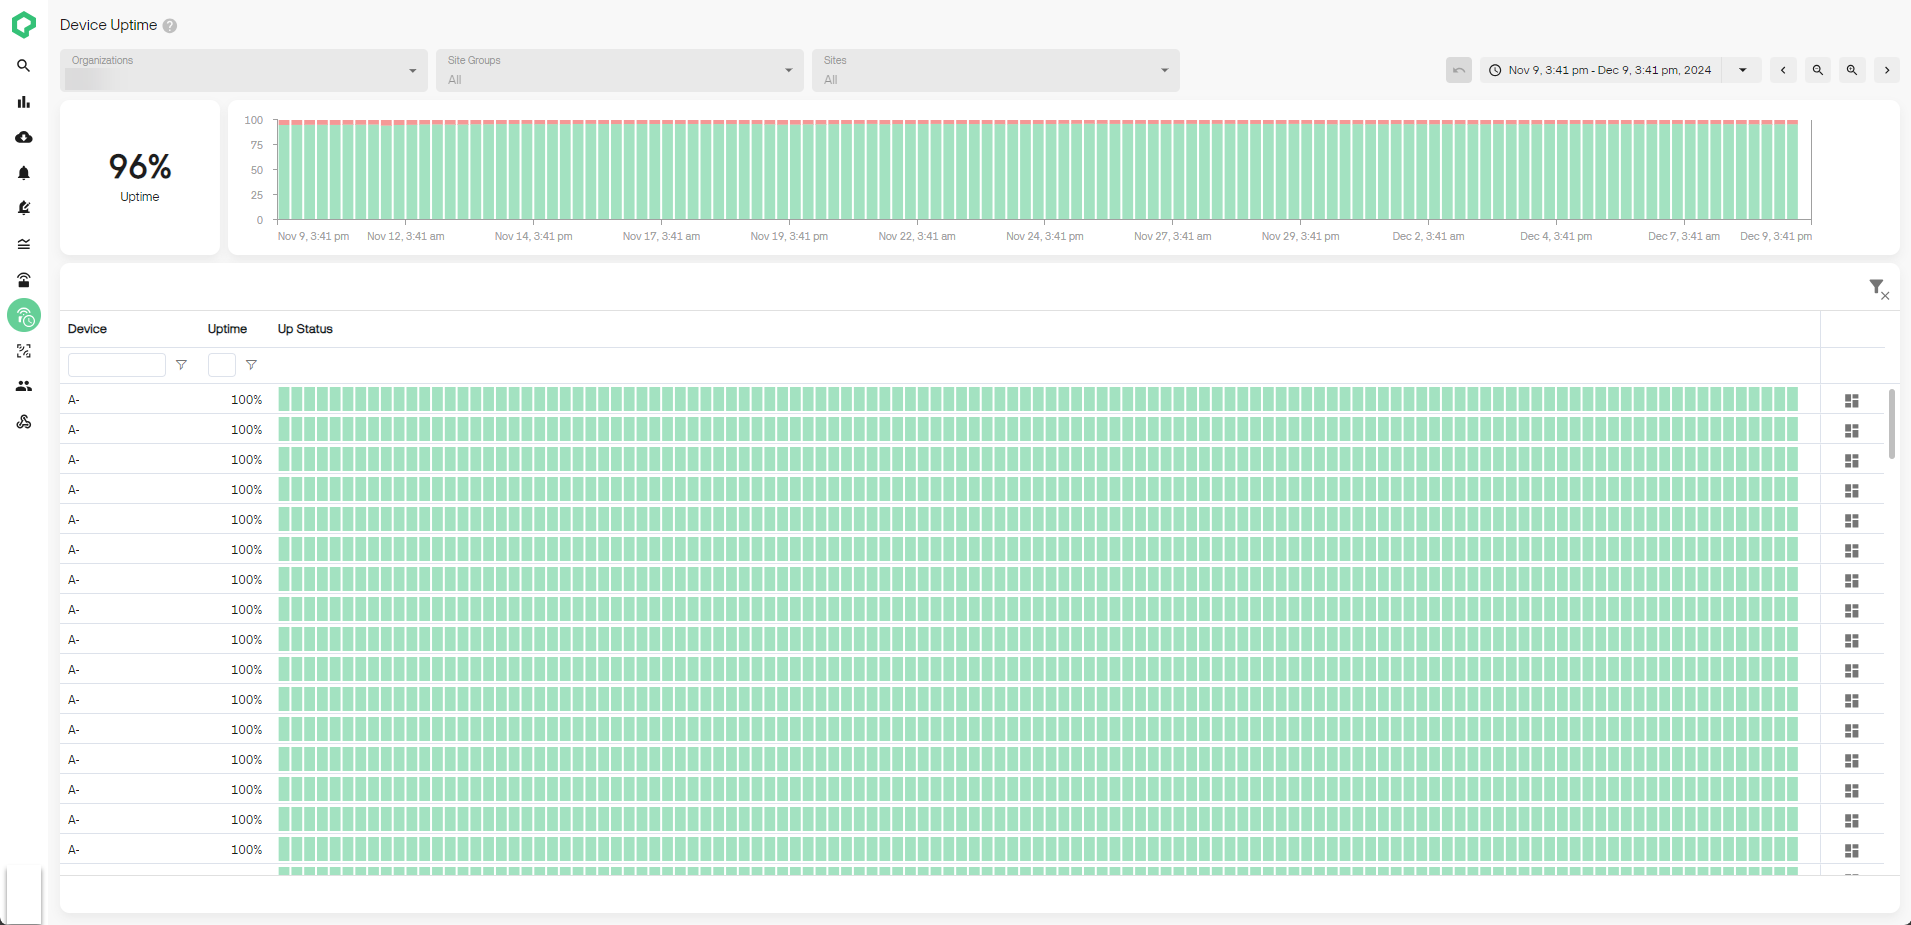
- Track Device Uptime Across Your Organization (Admin Only): Organization admins can now review Qube device uptime over time. Uptime is calculated for each device at 6-hour intervals and is rolled up into a fleetwide uptime score as a percentage of time. Track uptime over time at the device, site, or the organization level!
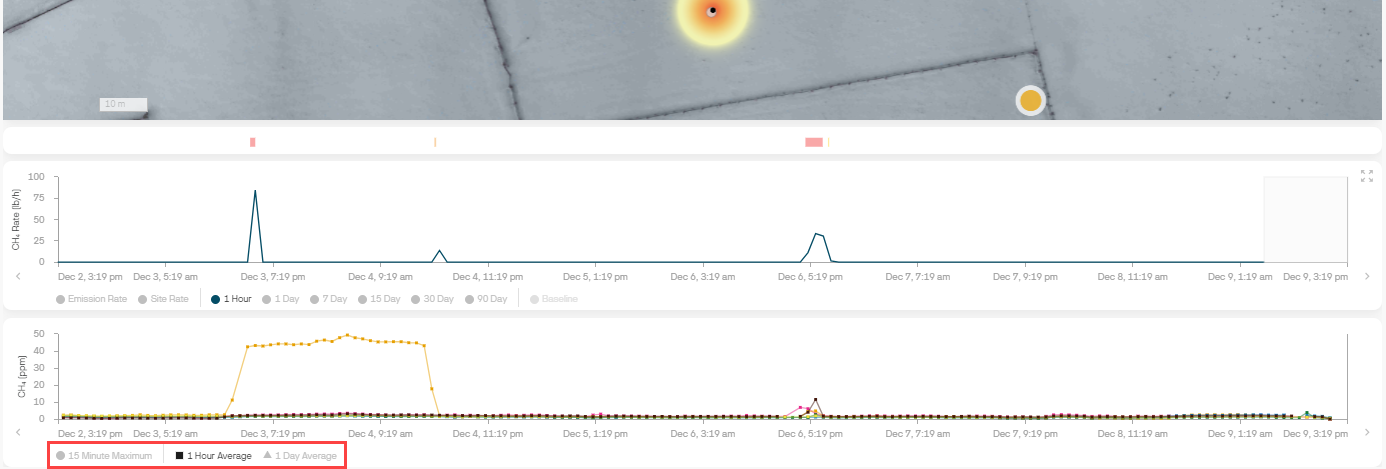
- View Gas Concentration Averages Over Time: You can now toggle between hourly and daily averages for your gas concentration time series charts. Filter out short-term noise and peaks to identify broad term trends over time. Toggles can be found at the bottom of any measurement-based time series.