Release 2.40
Site Baselines, Emission Rate Rolling Averages
What's New
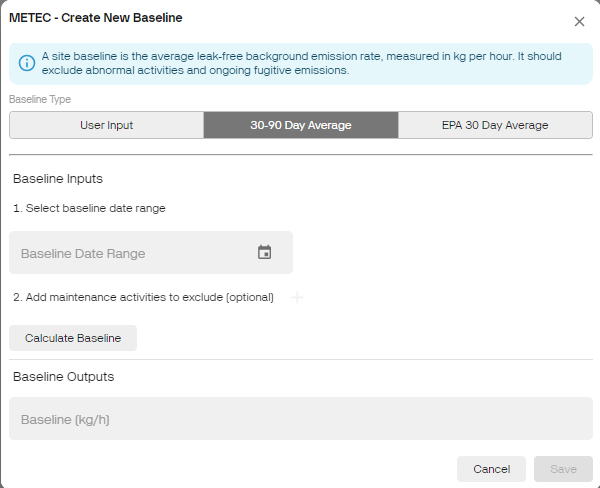
- Site Baselines: Improve your monitoring and managing of emissions using the Site Baselines Feature! Calculate your site's baseline using a yearly inventory, a 30 to 90-day average, or an EPA-compliant 30-day average. Set a specific baselining period that complies with EPA OOOOb/c. Easily spot over-emitting sites by comparing emissions against their baseline on the Emission Trends page or Site Dashboard.
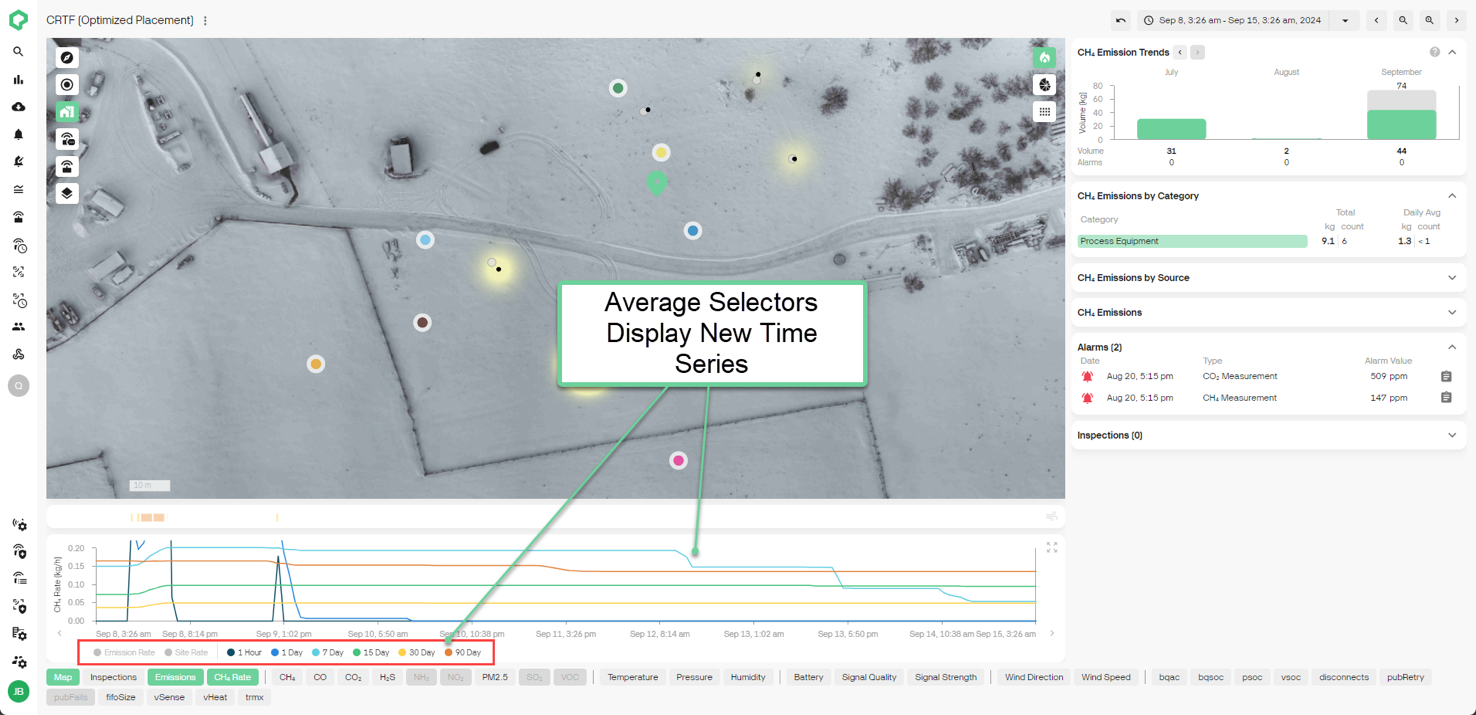
- Emission Rate Rolling Averages: Get a clearer view of your emissions profile over time with the new Emission Rate Rolling Average selector on the Site Dashboard. Choose from 1-hour, 1/7/15/30/90-day rolling averages, alongside the existing site and emission rate series, to monitor your site's emission rates more effectively.
What's Coming?
-
Site Status: Track and visualize site performance relative to baseline on the overpage and site dashboard.
-
AVO and Flyover Inspections: Integrated inspection management for logging AVO inspections and uploading third-party flyover inspections into the platform.
Other News
-
Qube is now SOC Type 2 Certified! You can rest assured that your data is safe with us!
-
If you have not read it yet, we highly recommend checking out our most recent blog post:
For more information on how to use these new features, please reach out to your Qube Customer Success Manager.